The world of workplace data and analytics is changing rapidly. To better understand its impact on our industry and its effect on facility managers, Don Sears, Senior Writer at Eptura, recently sat down with industry veteran John Hilderbrands.
John has spent over 15 years in the workspace software world. With a computer science background, John is an expert in communicating technical subject matter to non-technical customers. A self-proclaimed geek to his core, he has worked for our heritage Condeco brand and started when there was only a handful of employees working with major FTSE 100 customers.
Hilderbrands has worked in a variety of roles from director of support and customer success to our principal technical resource as Condeco expanded into the US. John now heads our global solutions engineering team supporting customers and partners in buying journeys across our portfolio.

Tell us about your background, John, what you do at Condeco by Eptura, and how long you’ve been working in the industry?
It’s been quite a while. Some would say born and bred because I came straight out of university. And I worked for about a year and a half for Rolls Royce aeronautical doing AV support. Then, moved to London and worked at R&M Systems (which became Condeco), so it was actually my first kind of true professional job where my computer science degree had some relevance.
I’m now in my 15th year. And it’s always been around employees, how they engage with workspaces. That’s literally been my entire career: 15 years of focusing on how employees engage with space, and how people manage the scheduling elements of space primarily. But obviously there was always touchpoints around the wider workspace conversation of how space is managed, how we fit into IWMS systems, how digital transformation is affecting the workplace.
In the end, everyone’s moving to some kind of hybrid working. Whether that’s single days in the office, allocated days, percentage of days or a week on, then week off. There are many different hybrid options.
And with Eptura now, it’s been really exciting to merge together with other workplace and asset management software leaders and suddenly have that wider scope of functionality with spaces and assets. It’s that working your world mentality. We’re now spreading our wings and getting experience across all these different areas.
So, tell us about your role specifically.
So, I’m the VP of Solution Engineering. Some people call me the ‘chief field sales nerd’. It’s a player-coach role. I run around assisting our sales team and lead my team in scoping the right solutions and supporting the value demonstration of our products.
We focus so much now on trying to demonstrate value in the buying journey. So, it’s not just popping in doing a quick demo and being like, hey, do you like it? It’s more about taking the customer on our part of their buying journey. And that can be from holding workshops with customers to actually workshopping how we can add value, providing feedback, support for security assessments … The technical scope of the buying journey falls to us. That’s what I do day-to-day.
How do you think the industry’s changed in your 15 years? What have you seen?
One of the biggest things is the change in the siloed nature of space management. I think it’s been shifting for a very long time. We had particular buyers that we focused on within the facilities world and we were trying to help them solve the operations of space, and then the management of space from a scheduling perspective.
But pre-pandemic, things were already starting to shift. People from IT are a very key piece in that journey. Not just from the procurement process but also from the employee experience point of view. And how experiences, and the tech behind it all, link into one another. So, it’s been very interesting as that has shifted.
And then you’ve also got the people management piece, the HR piece, and then you’ve got the people servicing those rooms and servicing the equipment in buildings. Customers have changed to be people-focused on much wider scope than just one area.
Some of our customers now have workplace teams. Their job is not FM, it’s not IT, it’s not HR. It’s actually the amalgamation of all three of those areas together. Sometimes the role can sit within HR and sometimes it can sit within IT.
The industry’s realized there’s this intersectionality of responsibilities and employee elements that make up their experience and make up the value of the workplace within a digital workspace context.
How do you think the role of data has changed in your 15 years?
That is really important because when we’re forming these strategies and these ways and these investments into space, we have to understand why and be able to demonstrate why and there’s not really any excuses anymore, right? There’s no excuse for finger-in-the-air guessing. The data is there to be had. And if you don’t make it presentable, easy to consume and allow people to make actionable insights from that data then you’re behind because everything else is able to do that …
We’ve had customers who have pieced that together themselves from siloed products. But that’s quite challenging to piece all those things together on your own. So, data is key to every single decision that’s being made. Gone are the days where the number one way of looking at workplace utilization was floor walking. That was the main way you did it: A clipboard, a piece of paper, and walking the floor. Then you add up the results. That was a service many of our partners provided. It’s very different today, right? It’s technology driven now. And then the outcome from that is really insightful data.
Go deeper. Learn what it means to have an analytics mindset in “The value of workspace data and analytics.”
So, what are some of the biggest challenges or trends that you’re noticing come to the surface today that might not have been there even a couple of years ago. I know the pandemic was obviously a huge influence on things, but anything else that you’ve noticed recently that that’s really come to the surface maybe in the last year?
There’s two things. At our most recent Flex customer events in London and Frankfurt where we held live polling. Customers are finding they don’t know enough about what’s going on in their spaces and they’re pretty sure they have too much of it. I think it resonates throughout our customer base and throughout the industry.
They’re saying “I need to understand how my space is being used now.” … I mean, there was this kind of industry standard of a one-to-one desk ratio or one-to-two desk ratio. But then the pandemic hit everyone and it put in place hybrid options.
And now the question’s more about, “I don’t actually know what’s going on in the space anymore.” Floor walking doesn’t really help because it needs to be looked at over a larger period of time. Everyone realizes they are not 100% sure, but they are pretty sure there’s too much space.
So how do they maximize the value of space based on how much they need? But also, how do I get people to engage with space that adds value to their employee experience and output for the company? Obviously, for businesses, the job is to create value for shareholders or whoever it might be that they’re trying to serve, whether it’s a charity or whatever it might be. How does the workplace help us achieve that? Because forcing people to come in isn’t necessarily the best way to achieve it. You have to offset the negatives versus the positives.
So how do we get all the benefits without any of the negativity because pre-pandemic everyone was in the office all the time. And now there is this fact for employees and leaders that there are benefits to not being in the office 100% of the time.
But the challenge is there.
Sometimes we need to have 100% attendance in the office. So how do we have a space that accommodates for that, right?
So, do you think that data plays a role in helping customers?
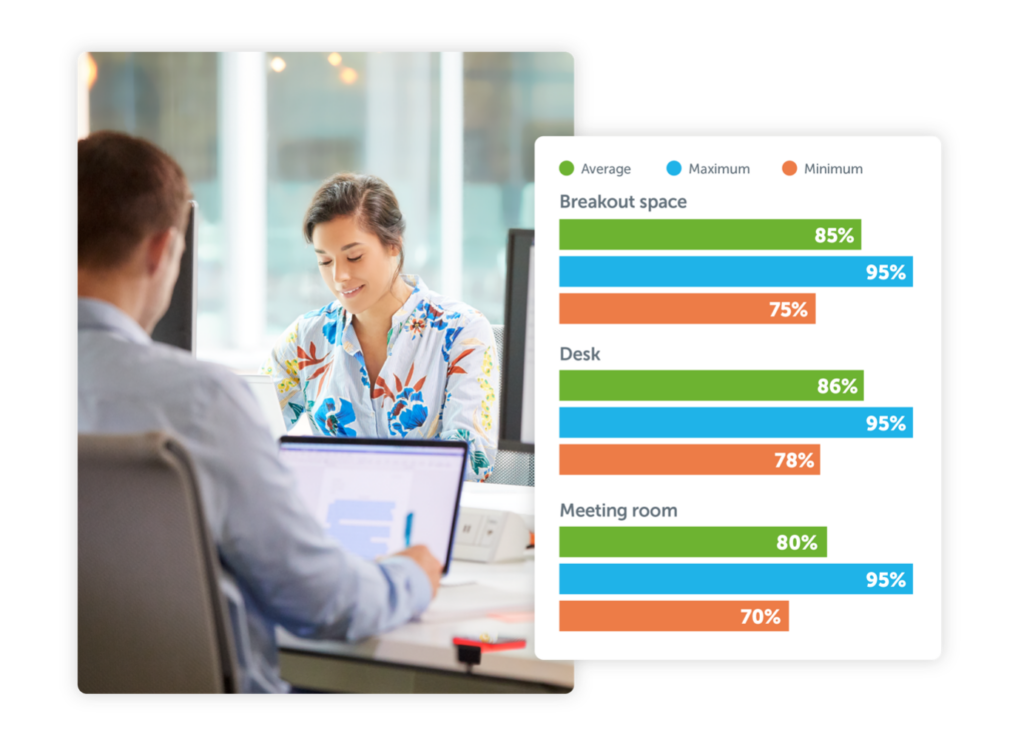
One hundred percent. It’s a combination. So, the data has to come from somewhere, right? Floor walking technically generates data but it’s a very manual method. Probably quite expensive. But it does generate data. So, I think data is core to any decision making, almost any decision making that you can that you can think of, but I think it needs to come off the back of the digital operationalization of space. So, how do you know? It could be a sensor that’s tracking the user space. Using a scheduling tool that captures desk, meeting rooms, and other space bookings: That is capturing the data.
So, then the question is have you got all of the things you need to capture? Data answers that question of what’s going on in my space. You need the tools and the data and then you can start to make decisions about how you need to move forward.
Do you know the differences between descriptive, diagnostic, predictive, and prescriptive analytics? Go deeper in our detailed blog post “How to use data analytics to grow your business”.
What do you think about the role of spreadsheets today? It’s still very prevalent, but what’s your take on how customers are using them? Is it changing at all?
Well, I think Microsoft has changed a lot of it in the sense that if you actually use a spreadsheet today in Office 365 and then you click the “Data Transform” button, it loads a Power BI data transformer. So, it’s actually the same as using Power BI in terms of the level, but the output is a pivot table which are not that cool in terms of their visualizations.
I think Excel and Power BI analytics tools are becoming more synonymous with each other. It’s like a subscription level. If you go and buy the Microsoft standard Productivity Tools, you get data transformation tools and Excel, but if you pay the extra, you get data transformation tools and Power BI for for advanced visualizations. So I think Excel is becoming more and more powerful and if you think about it from an ROI perspective, if you have a limited amount of data, and all you’re doing floor walking three times a week and then you want to add that data up. The ROI of Excel is perfectly reasonable here, right? And you can now have Excel in SharePoint so everyone can access it and collaborate on it and things like that, whereas it’s not files flying around.
The problem comes when you want to then turn that into actionable insights. Because you can collect a load of data, you can stick in some pivot tables, you can even transform a bit of that data much better than you could do years and years ago. But you’re going to be able to put that in front of your C-Suite, your CEO, and ask for change, I think that’s difficult.
Whereas if you have an actual interactive dashboard that you can filter, change, edit, export, that is a much, much easier to be able to take to a decision maker. You can eventually get there with Excel. It just takes you a lot of time and effort and skill set.
There’s someone on my team who has a Master’s in data analytics. He’s a data scientist. He’s an absolute wizard on Excel. But he wants to use BI tools. He doesn’t want to go through Excel, you know, because he knows it’s faster for him to interact with a BI tool. And in our case, it might be Power BI, but there’s also others out there, you know, Tableau, and many more. The value of doing that is the speed with which you can do these things and being able to see them from different points of view.
But I think the difference I like to talk about is transforming data into something to act upon. When it goes to that next step of becoming insights, that is only possible when you start to visualize data and compare data and look at the trends. I think that’s really important to be able to look over longer periods of time or at a specific time period — whether that’s one week, two years, three years, whatever it might be. It should give you the ability to make decisions about the future.
For example., understanding the intent of your users and having them be able to look at the data is really important as well. When you want to actually understand what might be happening, when you’re answering that question of what’s going on in my space, data alone doesn’t answer it. Analytics on top does kind of answer it. But what our analytics engine does is take it that little bit further and take it to insights.
 One of the best examples we have is one that looks at how far in advance people book versus the amount of no-show percentage. So, if you think about this, if you let people book six months, 12 months in advance, the percentage of time that they don’t show up to the meeting goes way up. And conversely, it goes down the closer to the creation time of the booking date. This is really useful when you want to start to talk to the business about shortening that advanced booking period, such as, how far in advance they could book for maximum efficiency.
We know today’s facility managers and workplace strategists are working with a diverse set of departments across organizations. What human resources or the information technology team may need might be different from what the C-Suite needs. What’s the value of having analytics to be able to inform decision making at the many different levels in an organization?
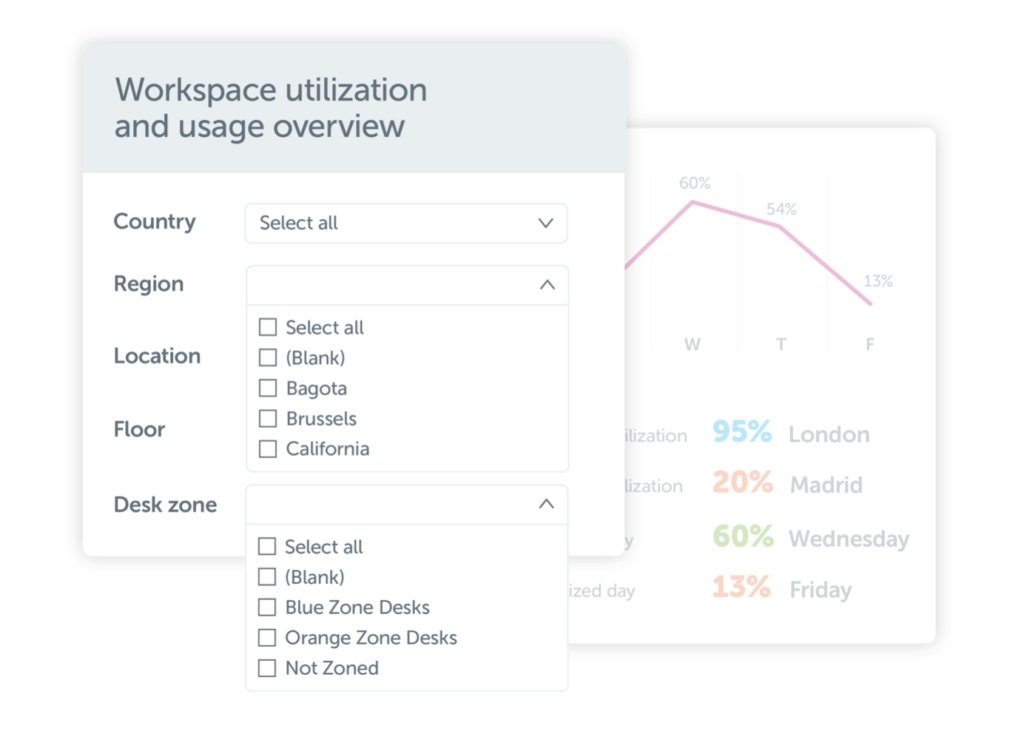
There are definitely different levels that people need to understand. Someone on the C-Suite might be interested in the trends of how the workplace was being utilized across different types of spaces for the last six months so that they can plan and authorize budgets for the next two years. But someone who is operating a single location, they might be interested in a slightly different scope of data. I think there’s two elements is almost the horizontal and the vertical, right? Horizontal is how the insights are framed. And this is where we have different dashboards, for example, that are telling different stories, right? They’re giving people the visualizations they need to understand the different factors.
And then you have the vertical scope which is “Am I looking at this from up here or am I looking at this from a smaller scope?” Maybe I’m in charge of one floor, maybe I’m in charge of one building, maybe I’m in charge of one country in a multi-country implementation of the product. It’s different lenses. These dashboards are different lenses looking at the same data. And then you have the vertical view which is really comes down to filtering.
I’m part of our workplace culture team at Eptura for our London office whose job it is to look at the value of our space and how it affects our culture. We can look at the booking intent of our employees over the next six months or maybe over the next three months or maybe the next two weeks … And I was very interested in the immediate last two weeks. Whereas our CEO, for example, Brandon, he might be more interested in what’s happened over the last 12 months or he’s interested in Atlanta, or Winnipeg. He’s could be interested in our Frankfurt office view. So, there’s an example of the horizontal.
The vertical view is more about the scope and the duration of time you’re looking at, whereas the horizontal is more around the type of data area, the data subjects you’re interested in.
So, we have dashboards that focus on utilization. Someone might be interested in utilization, but an AV person is probably more interested in utilization of rooms that have audio visual equipment. They might be really interested just in that subset of data. So, they would use a different dashboard than someone on the reception team who wants to encourage people to turn up to their meetings. They might be more interested in no shows versus duration.
At the moment with our embedded analytics we are very much focused on offering insights up on a silver platter, making it really, really easy to consume. You don’t need to know how to be a data scientist to consume it. You can get actionable insights very quickly.
But if you are old school or you’re working with others who are a little bit old school, in a couple of clicks, you can export the data into a CSV Excel file. In near-future versions, we’ll start to see the ability for customers to connect directly to the data market.
What does it mean to be a data-driven organization vs a data enabled one? Learn more.
So artificial intelligence is very much on everyone’s mind. What role does AI have in space planning and analytics today and what will it look like in the near future?
I think it’s a huge piece. Look at some of the things that our sensor partners like VergeSense have done with the ability to analyze data and come back with suggestions and insights using AI.
What we have at the moment are language models, right? Which is a kind of subsection of AI. Some people would assume AI means sentience like Data from Star Trek, right? (I’m a massive Trekkie) but you know we’re not at sentience. We are at large language model understandings which is great for analyzing data. To be fair, ChatGPT and OpenAI have really taken it to the next level. But Microsoft was already on a pretty impressive path with Power BI where you could ask it questions and it would look at your data and try and give you answers – and it did a pretty good job and it’s going do an even better job. One of the things that’s really great about Eptura is we’re leveraging the Microsoft platforms for this, and Microsoft has brought out a lot of fantastic OpenAI functionality within Bing. Right now, however, it’s actually dependent on ChatGPT services which means that you are giving up all your data to ChatGPT. They can do whatever they want with it.
So, for our global customers who are using different levels of security around their data, we take it very, very seriously. Our chief security officer, James Carder, and everyone here is really excited for Microsoft to be bringing out new services based on the ChatGPT language model that are regionally hosted and not passing on your data to third parties. We want to give an extra comfort level to our customers.
And because we’re using Power BI already, I would say watch this space. It won’t be too far off where we’ll be able to ask your Condeco analytics dashboard, “Hey, what’s going on in my office next week.” There is a slight lag for some technology adoptions when you have significant data protection in mind.
I think AI is going to be a game changer once it’s a bit more private. Having a trusted provider like Microsoft being able to keep the data processing within their sphere is extremely exciting because that’s when you’ll see multinational organizations adopt at a larger scale. They will leverage it and then products, such as our own, will be able to really leverage that in a secure and private fashion.
It’ll be really interesting when it comes to how we plan space. I think that is the next evolution. We have tools and products that are very much expertise in allowing people to plan how their space works and how their space is configured. What’s going to get the best utilization of space? What’s going to get the best productivity?
You might say “I want marketing and sales to work closer together,” so I can then create a space plan where marketing and sales are all mixed up together. Or maybe I don’t want marketing and sales to work together, I want them completely separate, and so I put a big wall up between them, so I put them in two different offices. And so that kind of intelligence, which at the moment is all humans making decisions from analysis.
I think it will evolve more to be recommendation driven by AI. Facility managers and workplace strategists will be able to ask for suggestions. People will still need to be the ultimate arbiter, but instead of it taking 25 hours to reconfigure two or three floors, it will take 20 minutes. And then you would have reviewed 10 different setups and chosen the one you think is the best to achieve the goals.
What that means is the workplace can start to react faster. At the moment, corporations using physical space react slower than, say, the retail market. It used to be when I was first working you’d come into the workplace and it was the most technologically advanced place you went to, right? Everything was more advanced than at home. At home you had an abacus and at work you had a computer. Whereas now it’s actually a little bit the other way around in a lot of places. I mean, I’m sitting here in a home that’s completely kitted up with Nest stuff everywhere, a big 34-inch monitor with cameras, and everything all around because I’m a massive geek. But at the same time, I go into a workplace and it’s not always the same.
The workplace needs to start evolving quicker and that’s very difficult to do when you’ve a lag with the human element. So yes, I’m really quite excited for how AI is going to let us move faster and allow decisions about space be realized with more velocity.
It’s interesting because when we talk about AI we often forget the other major parts of AI are the machine learning, the pattern recognition. It’s all the things under the AI umbrella. Ultimately, what’s interesting are the opportunities for gaining efficiencies and for being able to turn out a space plan very quickly.
Look what we noticed in the last year: Many companies are trying to rightsize their space. Customers think they have too much space because it’s not being utilized. What if you knew what you could cut? What if you could cut the hours that it takes to figure out how much space you need? Instead of being able to iterate four times a year, you could iterate ten times a year. You’d then be reacting to the needs of your employees and reacting to the changing environment quickly. I think that’s one of the challenges that that we have in in in business in general but especially in managing space is being able to react quickly.
And it’s not just the space planning, it’s the procurement process, it’s the leasing contract process. Think about the average lease of 5-10 years. It’s difficult to react quickly. But if we can create spaces faster, and be more flexible, then we can understand how they’re being used and iterate from there.
One of the most interesting stories from our Flex event was from a customer of ours who’s using an agile scrum sprint-based approach to space. They make small iterative changes each sprint and then they see what people think. They move the desks from here to here, they might put a ping pong table in, take a ping pong table out. They iterate, right? And this is what makes software such an amazing area to work in, is that iteration, that speed to iterate, get feedback, pivot again.
The goal of the fail-fast aspect of agile software is to get to the best outcomes quicker. It’s an enabler of pace and then we’ll see the pace of change within business start to pick up. The one thing that is kind of challenging in some respects might be you know it’s hard to fail fast in real estate because you sign a lease.
And yeah, I mean, if you get that, you can suddenly sort faster to realize that you can cut some, can’t change the four walls piece. But if you think about it from an ESG perspective, if you shut down a floor, that still saves money, right? So it doesn’t matter if you’re paying the lease or not, if you’re not running the HVAC, if you’re not maintaining the stuff, not cleaning the space, you’re still saving notable sums of money. So, if you had an AI-based assistant or if you looked at the data and understood from a dashboard that you’re only using 50% of your space you could just shut down 50% of your building. Let’s go from a one-to-one desk ratio to a one-to-two desk ratio tomorrow, and let’s just see what happens. And if employee feedback is “we hate this, we want more flexibility.” Then we’ll go to a 1.15 ratio or something. So, we open up a little bit more of this space and we can start to kind of fail fast and configure to our needs.
Obviously, it’s different when you’re talking about hospitals and non-traditional office spaces. That’s a whole different kind of ball game because it’s all about not failing in those in those industries at all. But I think for the average office space, we could be more aggressive, and I think people would be more understanding. I think there’s a fear that is blocking us from moving forward quickly and I think AI will will really help with that. Yeah. And
Can the analytics and insights available from workspace data in these dashboards help you adjust your hybrid work policies? Can it help you define and evolve your hybrid work policies?
Yes, because you have the facts. It’s one thing to show intent and that we plan to come in these specific days but then the actuals are in your analytics. Here are the facts so we can compare to what we actually did. I mean, how do you know if you succeeded or not if you’re not able to measure it?
This goes back to that question our customers responded to at the Flex event of not knowing what’s going on in their spaces. So you need the practical digital tools to do it. Once you start measuring and you get a baseline and then you go, well, let’s make some changes and then you measure again and then you take some changes and then you measure again. It’s all about making informed decisions.
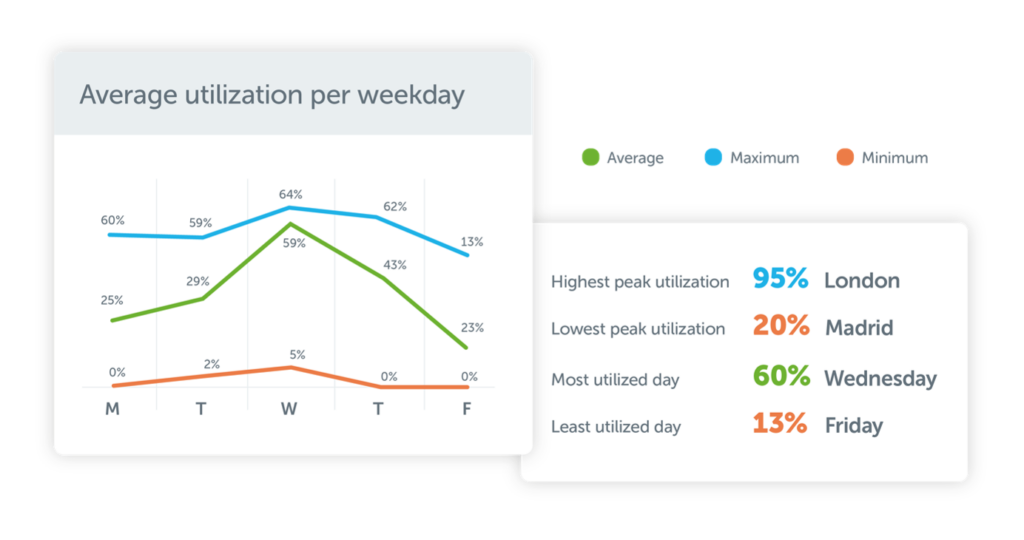
What’s more, every company is quite different now, right? It used to be that most companies just all did the workplace the same way. Everyone did 9:00 to 5:00 in the office, and it was all pretty much the same internationally. But now every single company is all a bit different because now culture is king. The cultures defined within a company are very much unique. Each company has its own personality. Some companies very much love to be and sometimes it’s led from the top definitely. And each different industry has different needs around physical presence.
There’s no one rule, there’s no one-size-fits-all. And I think one of the things that we’re doing with our products is that we are presenting the information, presenting the insights, and providing the tools for people to manage their workplace. We’re not dictating you how you should do it. So if you’re running a one to one desk ratio and you’ve got people coming in five days a week, we can help with that … If you’ve got a flexible situation where you’ve got people coming in for an average of two days a week, one day a week, one day a month.
And you want the space to be managed and really understand how it’s operating, and then potentially right size and reduce space or whatever it might be, we can help with that too. We’re not here to dictate the way our customers need to work. We’re here to facilitate the world of work and then provide the actionable insights off the back of that. And I think that’s one of the fundamental ethos of Eptura that makes us quite relevant across different industries and customers.
Goodbye, guesswork. See exactly how office space is being used today.
Get greater visibility into work environments and utilization trends with Condeco Analytics Advanced. Make data-driven decisions faster and with more accuracy.
No more tiny columns and rows of numbers in a spreadsheet. Time for rich dashboards using data in context directly within the workplace scheduling system you already use. Say yes to dynamic data.
You can now:
- Gain in-platform workplace intelligence, eliminating the need to export and manipulate data in third-party tools
- Uncover multiple dimensions of data to understand strategic and more granular drivers of workplace utilization and occupancy across all resources and locations
- Customize views by timeframe, office location, resource type, floors and office hours to measure behaviors
- Produce data-driven insights into historical resource usage and harness top-tier analytics capabilities to plan for future space needs
- Create custom bookmarks to save filtered views of specific workplace information and share these key insights with relevant stakeholders
- Refresh data in real-time to get the most recent insights and leverage accompanying Power BI templates to further analyze data offline
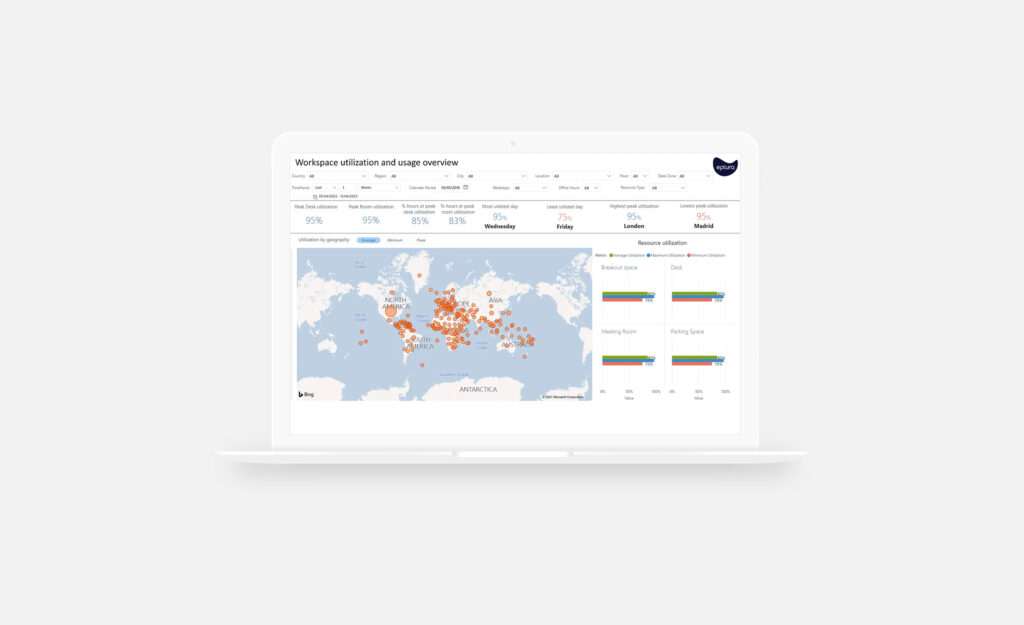
Go beyond the headlines and anecdotal feedback and deliver data-driven insights around workplace resource usage, employee engagement, and long-term demand trends.
Learn more about our Workspace Management software.
Don Sears has over 26 years working for technology companies or covering them as a journalist. In his current role at Eptura, he writes across topics at the intersection of workplaces and workspaces with an eye on innovation. Previous roles include technology editor at PC Magazine and research writer at Gartner. In addition, he’s worked at a marketing agency for clients: PNC Bank, UPS, and MSC Industrial. His work has been published in Fortune and has written for Workday, VMware, and American Express. He lives in Brooklyn, New York.
